
Title: SS-OCT image analysis
Challenge description:
Optical Coherence Tomography (OCT) is a retina noninvasive imaging technique widely used for diagnosis and treatment of many eye-related diseases. Different anomalies such as Age related Macular Degeneration (AMD), diabetic retinopathy or Diabetic Macular Edema (DME) can be diagnosed by OCT images.
Due to the importance of early stage and accurate diagnosis of eye-related diseases, providing high resolution and clear OCT images is of high importance. Therefore, analyzing and processing of OCT images have been known as one of the important and applicable biomedical image processing research areas.
Different processings have been applied on OCT images, such as image super-resolution, image de-noising, image reconstruction, image classification and image segmentation. Despite many algorithms working on OCT image analysis, still there is a need for improving the quality of the resulting images and the accuracy of classification. Therefore, this challenge has been dedicated to the problem of OCT image enhancement and classification and contains the following three tasks:
1- De-noising of noisy OCT images
Since many of captured OCT images are noisy and this can highly decrease the accuracy of diagnosis of eye-related diseases, de-noising can be considered as one of the important steps in OCT analysis. Hence, this task is dedicated to the problem of OCT image de-noising. The task is to de-noise the available noisy OCT images and try to produce the best results. A sample for a noisy B-scan has been shown in Fig.1

2- Super-resolution
To prevent motion artifacts, capturing OCT images is usually done at rates lower than nominal sampling rate, which results in low resolution images. Using super-resolution methods, high resolution images can be reconstructed from the low resolution ones. Due to the importance of this issue, this task has been dedicated to the super-resolution problem. The aim is to obtain high-resolution OCT images from low-resolution OCT images.
3- Volume-based classification of OCT dataset into several sub-classes
The aim of this task is to classify several observed cases (where there are several B-scans for each case) into healthy (0), diabetic patients with DME (1) and non-diabetic patients (2) classes.
Keywords: Optical Coherence Tomography (OCT), De-noising, Super-resolution, Classification
Dataset:
The dataset has been captured in Didavaran clinic, Isfahan, Iran, using a custom-made Swept-Source OCT imaging system built in department. of Biomedical Engineering, University of Basel. The central wavelength and spectral bandwidth of the OCT system are 1064 nm and 100 nm, respectively. This dataset includes 100 volume OCT data from 100 subjects. These volume OCT data have been captured from different subjects and categorized into three groups: Healthy (0), diabetic with DME (1) , and non-diabetic patients with other ocular diseases (2) where, each volume contains several B-scans of size 300*300.
Approval of all ethical and experimental procedures and protocols was granted by IR.NIMAD.REC.1397.314.
References:
1 - M. Tajmirriahi, Z. Amini, A. Hamidi, A. Zam and H. Rabbani, "Modeling of Retinal Optical Coherence Tomography Based on Stochastic Differential Equations: Application to Denoising," in IEEE Transactions on Medical Imaging, vol. 40, no. 8, pp. 2129-2141, Aug. 2021
2- M. Tajmirriahi, R. Rostamian, Z. Amini, A. Hamidi, A. Zam and H. Rabbani, "Stochastic Differential Equations for Automatic Quality Control of Retinal Optical Coherence Tomography images," 2022 44th Annual International Conference of the IEEE Engineering in Medicine & Biology Society (EMBC), Glasgow, Scotland, United Kingdom, 2022, pp. 3870-3873, doi: 10.1109/EMBC48229.2022.9870918.
3- Z. Amini and H. Rabbani, "Statistical Modeling of Retinal Optical Coherence Tomography," in IEEE Transactions on Medical Imaging, vol. 35, no. 6, pp. 1544-1554, June 2016, doi: 10.1109/TMI.2016.2519439.
4- Amini Z, Rabbani H. Optical coherence tomography image denoising using Gaussianization transform. Journal of Biomedical Optics. 2017 Aug 1;22(8):086011-.
5- Kafieh R, Rabbani H, Abramoff MD, Sonka M. Curvature correction of retinal OCTs using graph-based geometry detection. Physics in Medicine & Biology. 2013 Apr 11;58(9):2925.
Evaluation:
The results will be evaluated using the following criteria:
1- For the volume classification task:
The algorithms which find more true results will have the higher accuracy.
The following evaluation metrics are used:
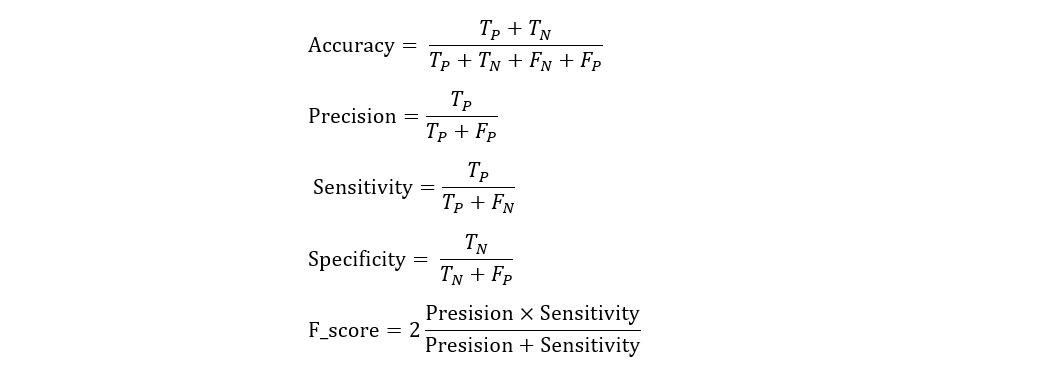
Where
TP: is the number of actual positive events which have been predicted correctly.
TN: is the number of actual negative events which have been predicted correctly.
FP: is the number of actual negative events which have been predicted incorrectly.
FN: is the number of actual positive events which have been predicted incorrectly.
2- For the de-noising task:
The aim is to obtain OCT de-noised images with the best visual quality, Mean to Standard deviation Ratio (MSR), Contrast to Noise Ratio (CNR), Texture Preservation (TP), and Edge Preservation (EP) measures. These measures do not need the reference image and choosing several regions of interest (ROIs) from the images is required in their computation. These ROIs consist of interesting details and significant parameters for the metrics.
• CNR metric is defined as

where σb and µb denote the standard deviation and the mean of the background region, while µf and σf represent the corresponding parameters for the foreground regions. The ROIs for calculating CNR are chosen between different layers to show how the contrast is changed.
• MSR is defined as follows:

where µf and σf are the mean and the standard deviation of the foreground regions (regions encompass the retinal layers).
• TP evaluates the conserving of the texture between two images and calculated as

where σm and σm’ denote the standard deviation of the de-noised and noisy images in m-th ROI. μin and μden represent the mean value of noisy and de-noised images, respectively. The ROIs for calculating TP should encompass the intra-layer regions.
• EP evaluates the conserving of the edges between two images and calculated as

where Im and I'm are matrices that contain the de-noised and the noisy image regions, respectively, in the m-th ROI. Δ represents the Laplacian operator and Γ measures the correlation of images. For EP , the related ROIs should include edges.
3- For the super-resolution task:
MSR and CNR will be used in addition to visual quality of results.
Participation rule:
The participants are requested to submit their results in all of three tasks. Each group Must submit a zip file named as “Participant name_ICIP2024_OCT_Challenge” which includes the following two items:
1- Results
A zip file including the output images for the test dataset (two separate folders for the results of super-resolution and de-noising tasks). This is not needed for the classification task.
2- Technical Report
Each group should submit a technical report that includes:
A comprehensive description of their methods including all of the details and results. The report should include the numerical results (based on the evaluation metrics) and sample visual outputs of their algorithms (for the super-resolution and de-noising tasks). For the classification task, the report should contain the evaluation results of the train dataset and classification results of the test dataset, i.e, it should be determined that each case belong to which group (0,1 or 2).
Note that team members who have previously accessed to the dataset are not eligible for the competition.
Team Formation and Eligibility
Team Composition:
- Each team MUST be composed of: (i) One faculty member (the Supervisor) and (ii) At least 3 but no more than 10 undergraduates; Optionally (iii) At most one graduate student (the Tutor).
- At least three of the undergraduate team members must be SPS student members at time of team registration.
- Further definitions of each team position are as follows:
- Faculty (Supervisor): A faculty member or someone with a PhD degree employed by the university. Postdocs and research associates are not considered as faculty members.
- Graduate Student (Tutor): A graduate student is a student having earned at least a 4-year University degree at the time of submission. Please note: Tutors are not eligible to receive travel grants or prize money.
- Undergraduate: An undergraduate student is a student without a 4-year degree.
- Team members cannot be changed after the team registration deadline.
- At least one undergraduate team member must be in attendance (in-person) of the final round of the competition held at the ICIP 2024 to present the team’s work.
- Students receiving the travel grant and prize payments MUST be active SPS members at time of team formation. Signal Processing Society membership can be added here.
Should a team be disqualified or forfeit their finalist position for any reason, the next team selected by the organizers may be contacted to compete in the final round, following the same rules listed above.
Important Dates:
1- Challenge announcement: January 2024
2- Release of the training dataset: 31 January 2024
3- Team Registration Deadline: 30 February 2024 [Register here]
4- Release of the test-dataset 1: 30 April 2024.
5- Final Submission of Team’s Work Deadline: 15 June 2024 [Submit your team’s work here]
6- Announcement of 3 finalist teams: 15 July 2024
7- Final competition in-person at ICIP 2024: 27-30 October 2024
For more information, please download the official document of the competition and visit IEEE Signal Processing Society: https://signalprocessingsociety.org/

Contact information:
Competition Organizers (technical, competition-specific inquiries):
Medical Image and Signal Processing Research Center, Isfahan University of Medical Sciences, Isfahan, Iran
Email: misp@mui.ac.ir
SPS Staff (Terms & Conditions, Travel Grants, Prizes):
Jaqueline Rash, SPS Membership Program and Events Administrator
Email: Jaqueline.Rash@ieee.org
SPS Student Services Committee
Angshul Majumdar, Chair
Email: angshul@iiitd.ac.in
Register for the competition using the following link:

Organizers:
Medical Image and Signal Processing Research center, Isfahan University of Medical Sciences, Isfahan, Iran
Professor Hossein Rabbani, Medical Image and Signal Processing Research Center, Isfahan University of Medical Sciences, Isfahan, Iran.
Dr.Azhar Zam, Tandon School of Engineering, New York University, Brooklyn, NY, 11201, USA and
Division of Engineering, New York University Abu Dhabi (NYUAD), Abu Dhabi, United Arab Emirates
Dr. Farnaz Sedighin, Medical Image and Signal Processing Research Center, Isfahan University of Medical Sciences, Isfahan, Iran.
Dr.Parisa Ghaderi-Daneshmand, Medical Image and Signal Processing Research Center, Isfahan University of Medical Sciences, Isfahan, Iran.
Dr. Mahnoosh Tajmirriahi, school of Advanced Technologies in Medicine , Isfahan University of Medical Sciences, Isfahan, Iran.
Dr.Alireza Dehghani, Department of Ophthalmology, School of Medicine, Isfahan University of Medical Sciences, Isfahan, Iran and Didavaran Eye Clinic, Isfahan, Iran.
Mohammadreza Ommani, Didavaran Eye Clinic, Isfahan, Iran.
Arsham Hamidi, Biomedical Laser and Optics Group (BLOG), Department of Biomedical Engineering, University of Basel, Basel, Switzerland
Publication:
The winners can submit the journal versions of their manuscripts to our JMSS journal (Journal of Medical Signals and Sensors) and after the review process, if it is accepted by the reviewers, we will publish their papers.